
Valuation Insights - What Works, What Doesn’t
In the Bible, it says that love covers a multitude of sins. Well, in the investing field, price covers a multitude of mistakes. For human beings, there is no substitute for love. For investing, there is no substitute for paying the right price – absolutely none.
- ARNOLD VAN DEN BERG
- Even as the art and science of equity valuation continues to rapidly evolve, the current state-of-art approach is what is called the DCF (Discounted Cash Flow) Model. A simplified version of the same provides insights into the interconnection of RoE, Earnings growth and P/E.
- Interplay of RoE and growth determines free cash flow: In business, growth is a choice. Companies can choose whether or not they wish to grow, and if yes, at what rate. Having chosen a growth rate, the level of investment required to achieve the same depends on their RoE. Consider a company with PAT of INR 100 in Year 1. It chooses to grow 20% next year i.e. earn additional PAT of INR 20 in Year 2. Now, if it enjoys RoE of 25%, to earn the incremental INR 20 in Year 2, it will need to invest INR 80 (20 ÷ 25%) in Year 1 itself. This leaves Year 1 free cash flow of INR 20 (100 - 80). If, however, the company enjoyed RoE of 20%, to earn additional PAT of INR 20, it would need to invest INR 100 (20 ÷ 20%) in Year 1. This would leave free cash flow of zero (100 - 100). Likewise, if RoE was 15%, the additional PAT of INR 20 would entail investment of INR 133 (20 ÷ 15%), implying Year 1 free cash flow of INR -33 (100 - 133), which means the company would have to infuse fresh equity of INR 33 to grow by 20%.
- All growth is not good: If a company’s RoE remains below Cost of Equity for long, then high growth actually detracts firm value, as the company has to raise significant levels of capital from its equity holders to fund its growth. If a company’s RoE is exactly equal to its Cost of Equity, then no amount of growth adds any value whatsoever the P/E in such case works out to 1÷Cost of Equity. Growth adds positive value only when RoE is higher than Cost of Equity.
- Beyond a point, growth adds more value than RoE: Once RoEs are comfortably higher than Cost of Equity, investors should seek Earnings growth to drive value, rather than further higher RoE. At the other end of the spectrum, low RoE companies add much higher value by raising RoE than growth.
- Sustaining RoE higher than Cost of Equity is a challenge: We deem Cost of Equity in India to be 13% i.e. the long-period return of benchmark indices. In 1988, there were 136 companies with PAT greater than INR 200 million and RoE greater than 13%. Of these, only 22 managed to sustain RoE greater than 13% every year through 2018
- Hyper Earnings growth is rarely sustained beyond 5-6 years: Hyper Earnings growth, say 25%, is rarely sustained beyond 5-6 years. So, investors need to be wary of stocks trading at exuberant valuations which factor in ongoing high growth rates to be sustained long into the future
- What works - prefer High-RoEHigh-Growth stocks: It is possible to classify all stocks on the basis of 10-year average RoE into High (above 15%) and Low (below 15%). Likewise, stocks can also be classified based on 10-year Earnings CAGR into High (above 15%) and Low (below 15%). Over 1998-2018, stocks with high RoE (> 15%) and high growth (> 15%) delivered the highest average stock return of 27% compared to 14% for the Sensex.
- Reasonable Price - what works, what doesn’t: We studied the alpha track record over 20 years (1998 to 2018) of four pricing techniques – P/E, P/E relative to market, PEG and Payback Ratio. (PEG is defined as trailing twelve-month P/E divided by next 3-year earnings growth. Payback Ratio is calculated as Market Cap divided by next 5 years’ PAT.). The summary findings are tabled below.
| Pricing heuristic | What Works... | What Doesn’t... | ||
|---|---|---|---|---|
| Metric | Alpha | Metric | Alpha | |
| PEG | < 1x | 19% | >3x | -10% |
| Payback | < 1x | 17% | >3x | -12% |
| P/E | < 10x | 5% | >50x | -14% |
| P/E relative to market | < 1x | 4% | >2x | -8% |
Bosch
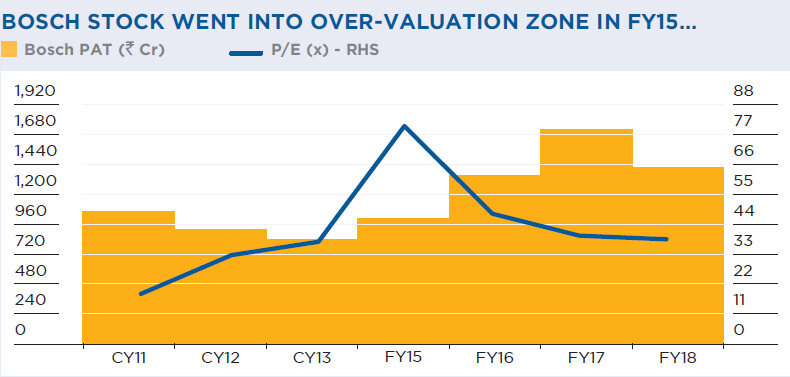
Bosch in 2015 captures most of the points made in this study in terms of not overpaying for stocks.
- Bosch is a market leader by far in diesel engine systems for automobiles.
- After muted profit performance in CY12 and CY13, Bosch reported 20% PAT growth in FY15.
- In the post-2017 elections Modi wave, markets ramped up Bosch’s valuation to over INR 80,000 crores, translating to a P/E of 80x.
- Bosch’s earnings grew 35% in FY16 and 28% in FY17, but couldn’t sustain and degrew 18% in FY18.
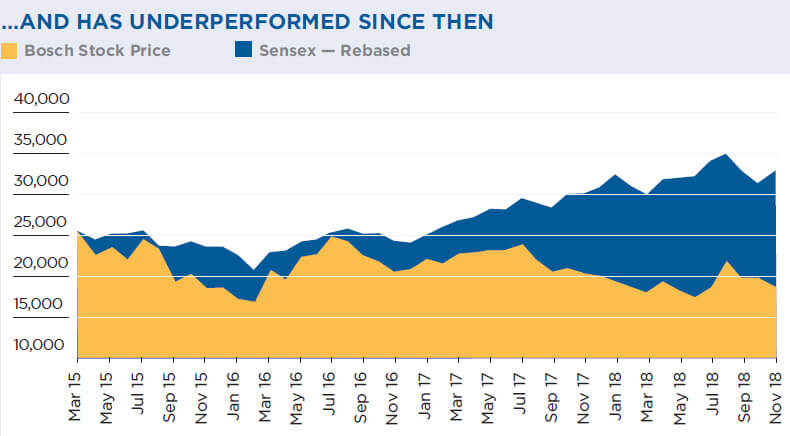
- Its P/E more than halved from 80x in March 2015 to 39x in March 2018.
- As a result, the stock delivered 3-year return CAGR of –11% compared to +6% for the market.

All about Price
The 23rd Wealth Creation Study is dedicated to the P of QGLP i.e. reasonable Price.
The final message is loud and clear – Overpaying doesn’t pay!
More often than not, high valuations suggest that much of the optimistic information about the stock is already in the price. As Thomas W. Phelps says in his classic 100 to 1 in The Stock Market, “A lemon that has been flattened by a steam roller has more juice in it than a piece of information the stock market has already discounted”.